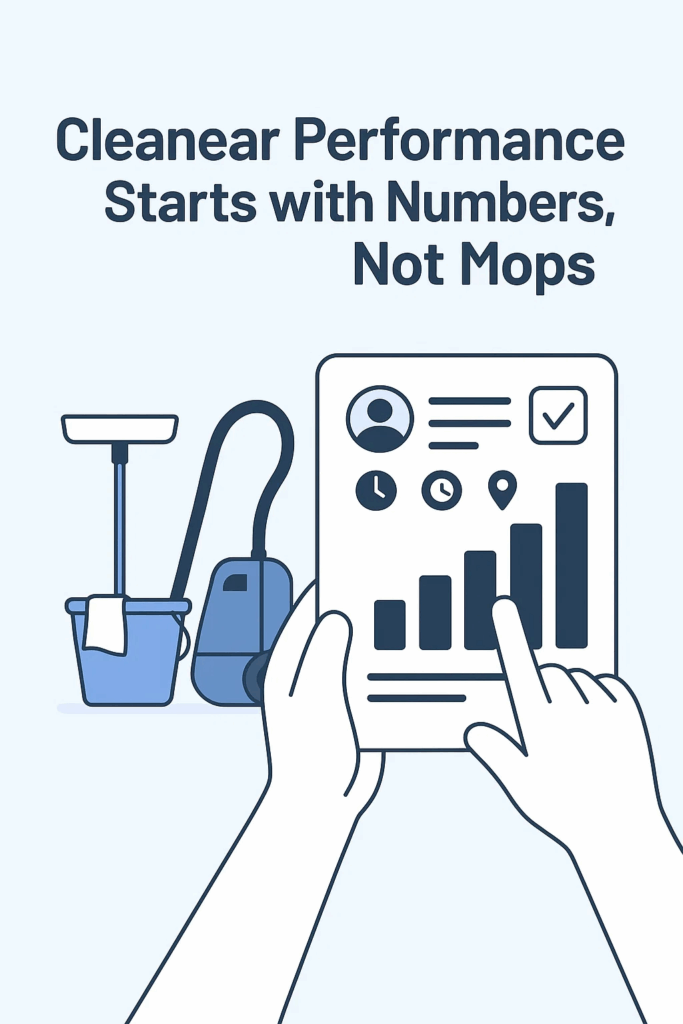
Cleaning still happens with mops, vacuums and rags, but cleaner performance happens with numbers. The companies that climb from one-off local vendors to strategic partners for multi-property brands are the ones that can prove every minute, mile and square metre.
That’s impossible if your supervisors are chasing technicians for crumpled time sheets and blurry WhatsApp photos. It’s effortless if every job is tracked, photo-verified and analysed inside Doinn, the short-term-rental operations platform trusted by more than 3 000 cleaning vendors in 61 countries.
Why Cleaner Performance Is the New Currency of Cleaning Contracts
Margin pressure is brutal. OTA rate wars squeeze property-manager profits; your quote is the first place they look for savings.
Quality is transparent. One dusty shelf reaches Airbnb reviews before your team leaves the car park.
Proof beats promise. Modern PMs demand geo-tagged photos, time-stamps and completion status, not “trust me.”
As conclusion, vendors who can show, not tell dominate RFPs and renewals.
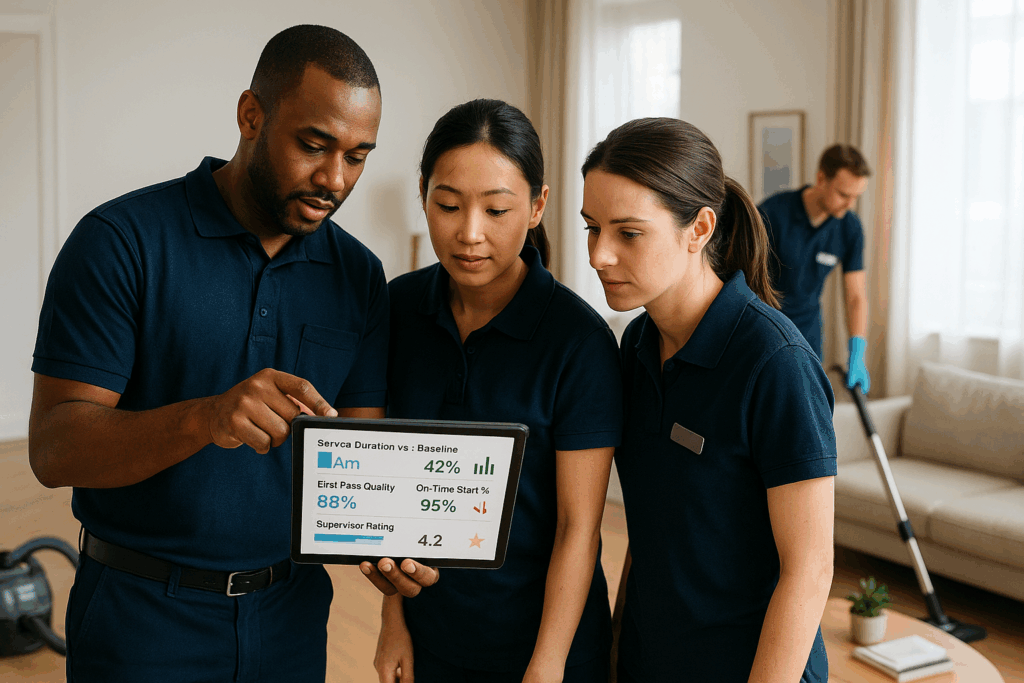
The Four KPIs to track the Cleaner Performance
KPI
Why it matters
Where you’ll see it in Doinn
How to act on it
Service duration vs. baseline
Reveals labour overruns and pricing errors
Insights → Staff → Services duration by member
Re-estimate catalogue; retrain outliers
First-pass quality rate
Re-work destroys profit and erodes trust
Insights→ Quality → Problems reported
Coach technicians; insert mid-service photo stops
On-time start %
Late starts cascade into guest delays
Insights→ Properties → Execution Duration vs Expected Duration per Property
Flag habitual late arrivers and take action
Cleaners rating (1-5)
Correlates with guest cleanliness score
Job Summary → Cleaner Review
Reward cleaners; share scorecards with clients
Note: Each KPI is generated automatically once technicians use the Doinn mobile app to Start, Pause and Finish a job or in the job summary rating provided by property owner/client.
The Cleaner Performance Toolkit
Mobile Clock-In / Clock-Out with Geo-Fence
Technicians tap Start only after crossing the property’s geo-radius; GPS and time-stamp flow into the job record.
Finish button stays greyed-out until required images are uploaded.
Add property-specific checklists for different types of properties to maintain quality.
Real-Time Dispatch Board
Coordinators drag-and-drop jobs, view live status icons (🟢 In Progress, 🟣 Paused, ✅ Done) and can catch any pending service to be assign rapidly. Board auto-refreshes every 30 s.
Service Analytics Dashboard
You can export the data on CSV to analyze in depth the monthly, quaterly or yearly resulsts.
Multilingual Ops Chat
40+ languages with instant two-way translation keep multinational crews synced (staff-only; guest inbox stays in PMS).
Benchmarks: Where Should Your Numbers Land?
Industry production tables such as ISSA 612 Cleaning Times list expected minutes per 1 000 sq ft for every task, vacuuming, wet mopping, restroom deep-clean, etc.
Example: ISSA says it should take 24.6 minutes to vacuum 1 000 sq ft with a 12″ upright. If your Doinn analytics show 32 minutes, you’ve uncovered an efficiency gap worth coaching or re-tooling.
30-Day Blueprint to Elevate Cleaner Performance
Day
Action
Outcome
1 – 3
Connect client PMS to Doinn; import properties & bed specs
Baseline catalogue auto-built
4 – 7
Configure checklist photos & duration targets
Proof framework set
8 – 14
Train technicians on geo clock-in app
Data fidelity ✓
15
Launch first live week with real-time dispatch
Visibility ✓
16 – 22
Analyse overruns; coach slowest 20 %
8 % labour-minute drop
23 – 25
Share KPI PDF with client
Stickiness ↑
26 – 30
Adjust pricing on high-variance properties
Margin recovery
Repeat monthly; after Q4 you’ll have 12 months of irrefutable data to justify premium bids.
Monetising Performance Data
Transparent bids: attach historical minutes per turnover to every RFP.
Bonus-malus clauses: your 97 % first-pass quality earns bonuses because you can prove it.
Avoid the Five Classic Pitfalls
Pitfall
Prevention in Doinn
Skipping baseline photos
Add photo task in checklists
Inflated times
Geo-track + Start/Finish on each service
Paper “black holes”
Digital assignment mandatory
Language mix-ups
Multilingual chat auto-translate
KPI overwhelm
Four-metric default dashboard
Conclusion: Data Turns Brooms into Billable Proof
As we’ve seen, cleaner performance is the new currency for winning and keeping high-value cleaning contracts. The difference between a replaceable vendor and a long-term strategic partner lies in the ability to show, not just tell.
By leveraging tools that automatically track every minute, verify every task, and analyze every outcome, you can eliminate operational guesswork, build unshakeable client trust, and protect your profit margins.
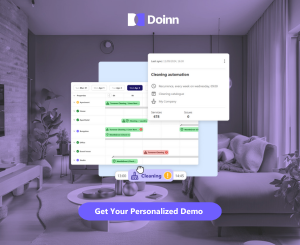
Ready to make your performance undeniable? Schedule your Doinn demo now and unlock the analytics and insights you need to grow your business.
Maximize Cleaning Staff Efficiency with Doinn
Book a demo today and discover how our platform can transform your business for 2025 and beyond!